


Project walkthrough · Schools
School Performance Dashboard
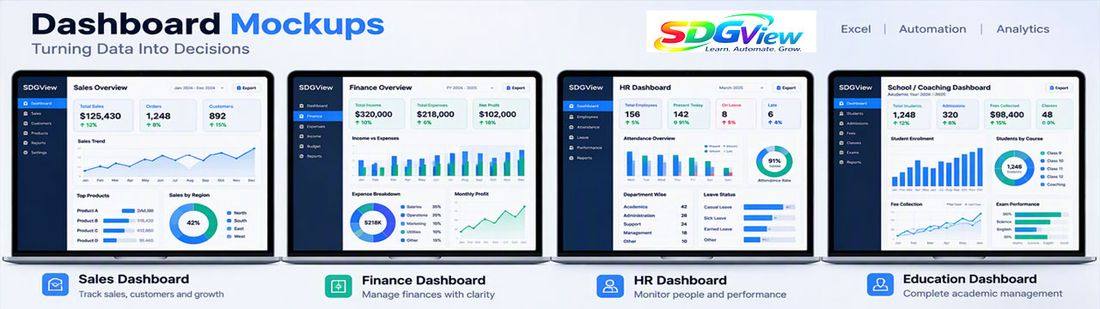
A comprehensive dashboard to track attendance, academic performance and institutional KPIs for a school.
Get a similar solution →Analytics • Automation • Impact
Excel, Power BI and SQL reporting built around your data.
9
Analytics & Automation Services
7
Ready Templates
6
Live Demo Dashboards
24h
Reply Time
What we do
Dashboards, automation and reporting designed around your goals and delivered in clear phases.

Interactive Excel dashboards with clear KPIs, charts and filters.
Learn more →
Power BI reports with solid data models, interactive visuals and scheduled refresh.
Learn more →
Targets, actuals and trends for the numbers that matter most.
Learn more →
Structured monthly management reports delivered on time and in the same format.
Learn more →
Database reporting, live dashboards and management reports from your own data.
Learn more →
Repeated business steps run by themselves, with checks along the way.
Learn more →Why SDGVIEW
01
Clear starting prices with no surprises.
02
Every build is tied to a real business outcome.
03
Practical scopes and quick turnaround.
04
Built around your data, team and workflow.
05
Automation and AI where they genuinely help.
06
We stay with you after launch.
Industries
Schools, NGOs, small businesses and consultants.
Results
Project walkthrough · Schools
A comprehensive dashboard to track attendance, academic performance and institutional KPIs for a school.
Get a similar solution →
Project walkthrough · NGOs
A data-driven view of beneficiaries, funding and SDG indicators for a development NGO.
Get a similar solution →
Client project · Small business
An interactive Excel dashboard with automated reporting replaced manual sales reporting.
Get a similar solution →Process
A transparent process with demos every 1–2 weeks. No surprises.
Step 01
A free consultation to understand goals, users, data and constraints.
Step 02
A clear proposal with scope, timeline, milestones and a fixed or phased quote.
Step 03
Workflows, wireframes and architecture reviewed with you before build.
Step 04
Agile sprints with demos every 1–2 weeks and your feedback built in.
Step 05
Testing, security checks, data migration, training and go-live support.
Step 06
Monitoring, improvements and new features as your needs evolve.
FAQ
We build dashboards, KPI tracking, MIS and SQL reporting, and automation for schools, NGOs, small businesses and consultants, so numbers become decisions.
Dashboards start from ₹2,999 and automation from ₹5,999. Larger or custom work is quoted after a free consultation.
Small dashboards often take days; larger or multi-source projects take weeks. You get a clear timeline after a short discovery call.
Yes. We train your team on your own dashboards and stay available for guidance after launch.
Excel, CSV, Google Sheets, SQL databases and exports from most business tools.
Free consultation and a clear proposal, usually within 24 hours. Call or WhatsApp +91 82103 28847.